Lesson 5: Are you getting richer or poorer?
The second step of the GreenBooks Method is Gain Insight. Although the Breakdown chart is by far the most important chart to observe to gain insight, there is another chart that summarizes your financial health in a single chart – the Trends chart.
Overall account balance trend
If you add all of your accounts into GreenBooks, the overall account balance in GreenBooks is essentially your net worth. A graph of your overall account balance is the most concise summary of your financial health.
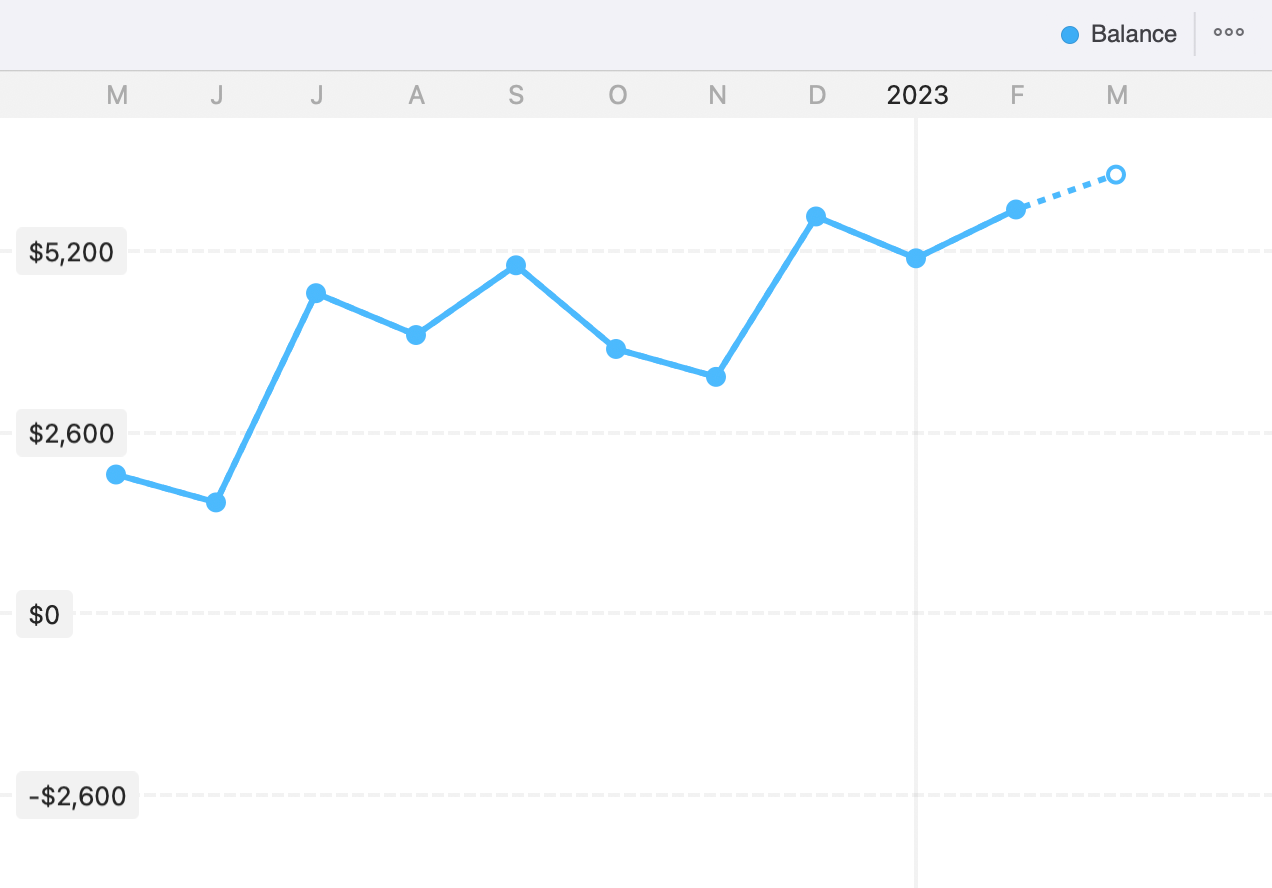
If the overall account balance trend is going up, you are getting richer. If down, you are getting poorer and need to work on your finances. It’s pretty simple.
Of course, the Trends chart can do more than showing you the ups and downs of your overall account balance. This video goes through the Trends feature in GreenBooks.
☝️ Summary
The second step of the GreenBooks Method is to gain insight. With the transaction data you maintain, you can gain accurate insight using your finance, and as a result always feel you are in control of your money.
The Breakdown and Trends chart are the only two charts GreenBooks has, and that’s by design. We don’t want to include any more chart than necessary for you to have a good handle on your money. And it turns out, Breakdown and Trends are the only two charts you need.