Lesson 2: See where your money goes
In Lesson 1, you learned how to enter your everyday transactions into GreenBooks, as well as putting those transactions into categories of your choosing. Once you’ve done that for a day or two, you can immediately see the impact of using GreenBooks.
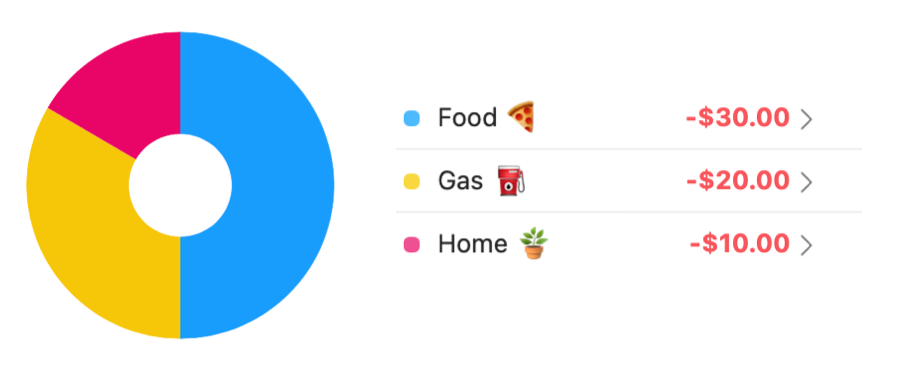
The single biggest reason for you to enter transactions into GreenBooks is to be able to see where your money is going in its Breakdown chart. With the Breakdown chart, you will be able to easily answer questions like:
- How much did I spend so far this month?
- What are my top spending categories?
- How much did I spend in each category?
- Is there any category of spending I should cut back on?

Having answers to these questions will modify your money habits. You will know to slow down in certain categories of spending, such as dining out, if you see you are spending too much in that category. By keeping a close watch on the Breakdown chart, you will be in control of your money.
Watch this video to learn about the Breakdown feature of GreenBooks.
And here is the good news, even though GreenBooks is a three-step method, the last step – budgeting – is optional if you have good cashflow. If you are not under the risk of running out of money in your accounts, just keeping tap on the Breakdown chart is enough to be in control of your money. If this describes you, you have already completed the GreenBooks Method!
☝️ Summary
- Breakdown chart is the most immediate value you gain when you start entering transactions.
- Breakdown chart shows you where you are spending your money, so you can modify your spending behavior.
- Other than spending, Breakdown chart also lets you analyze your income and other aspects of your money.
- Breakdown chart is the most important aspect of Step 2 of the GreenBooks Method: Gain Insight. It is the single most important chart inside GreenBooks.
As you use GreenBooks, be sure to check the Breakdown chart daily, to keep an eye on your spending habit.
